Saturday, July 29, 2023

El Niño events: what are they, and what does it mean when we're in one?


Every few years or so, you’ll hear or read in the news that the Earth is entering what is called an El Niño event.  What exactly does that mean, and how are El Niño events like the one in its early stages now linked to global climate?

In the eastern tropical Pacific Ocean, warm surface water is normally blown westward by the trade winds, allowing colder water to rise up to the surface.  Periodically this motion and the corresponding upwelling get stronger.  But equally periodically the motion and upwelling get suppressed, and the eastern Pacific gets unusually warm.  The Spanish settlers in Peru observed unusual warm spells around Christmas time due to these events, and called them “El Niño” in honor of the baby Jesus.  The other end of the cycle would eventually get called “La Niña.”  The scientific community eventually spotted a correlation between El Niño and La Niña events and a previously observed cycle of air pressure variation in the South Pacific called the Southern Oscillation.  As a result, scientists typically refer to the phenomenon as the “El Niño Southern Oscillation,” or ENSO for short.  The National Oceanic and Atmospheric Administration, or NOAA, quantifies this phenomenon using a number of different factors in the form of a number called the multivariate ENSO index (MEI).  This number is positive during El Niño events and negative during La Niña events.  Figure 1 shows the plot of the index vs. time since 1980.  There were particularly strong El Niño events in 1998 and 2016.  A prolonged La Niña event lasting over three years ended in early 2023, but now the cycle has finally reversed and an El Niño event is gathering momentum.


Figure 1: NOAA's multivariate ENSO index plotted vs. time.

El Niño events are well known for their ripple effects that spread across the globe.  Southern California typically gets quite a bit more rain during an El Niño event than it normally gets, for example.  Hurricane activity, in terms of both frequency and magnitude, typically intensifies in the Pacific and dampens in the Atlantic during an El Niño event.  The last strong El Niño in 2016 produced a hurricane in the Pacific whose maximum sustained winds exceeded 200 mph, a first among recorded storms.  And during a La Niña event, these hurricane patterns are reversed.  But the ENSO cycle produces a “big picture” effect as well.  The cold water that normally upwells to the surface in the eastern tropical Pacific cools the air above it, but the suppression of this upwelling during El Niño means that the sea surface is warmer than normal.  This warms the air above it, causing a significant increase in tropical air temperatures which then spreads globally.  As a result, global mean temperatures tend to be warmer than normal during El Niño events and colder during La Niña events. 

This can be observed in global temperature records.  Figure 2 shows the seasonally averaged global mean temperatures from the NASA/GISS dataset.  Most years that break a temperature record are years with El Niño events, and most years with relatively low temperatures (excepting major volcanic eruptions) are years with La Niña events.  The ENSO cycle is in fact the dominant source of short-term natural variability in the temperature record, greatly surpassing the variability due other factors like incoming solar radiation.  Failure to account for this phenomenon, whether through an honest misunderstanding or willful misrepresentation, has led to poor interpretations of the temperature record in the recent past.  After the exceptionally strong El Niño in 1998, for example, La Niña events dominated the cycle for more than fifteen years and it took until 2014 for global mean temperatures to unequivocally exceed the 1998 peak.  This led many people to proclaim some variant of “global warming stopped in 1998,” or “global warming went on hiatus,” but the updated temperature record clearly shows that didn’t happen.  Besides, the extra upwelling of cooler water in the eastern tropical Pacific during La Niña events leads to extra downwelling of warm ocean water in other locations.  This warm water carries some of the Earth’s additional heat down with it.  And last time I checked, the oceans were part of the globe.


Figure 2: The seasonal means in the NASA/GISS temperature record, both globally (top) and in the tropics (bottom).

Since the really strong El Niño of 2016 and the corresponding sharp peak in global mean temperatures, the La Niña events have again dominated.  This has temporarily kept global mean temperatures from shooting past our previous record high, but now the cycle has reversed.  We are seeing significant heat waves over much of the world, a number of days in July have set and reset the bar for the warmest day ever recorded, and July is likely to end up hotter than any other month on the record.  There is a real possibility that 2023 will be the warmest year on record, despite a fairly cool start.  And the El Niño event is just getting started.  A strong enough El Niño could even push global mean temperatures temporarily more than 1.5ºC above pre-Industrial levels, a threshold which adherents to the 2015 Paris Agreement promised to try to avoid.  

To summarize, the global temperature effects of the ENSO cycle oscillate around the increasing trend due to greenhouse gases.  What we’re seeing now isn’t the new normal — yet — but the 2016 El Niño made the 1998 temperature peak look cool in comparison, and we need to face the very real possibility that the next big El Niño after this one will make this summer seem cool.

(For updates on new posts, please click the "Follow" button.)

Wednesday, July 12, 2023

One Hazy, Crazy June


The Sun, still high up in the sky over Long Island on June 7, 2023, taken on my phone without any sort of filters or adjustments.

Over the past month, the northeastern United States has experienced a series of very large haze events due to forest fires in eastern Canada.  Since haze is an example of an aerosol, and aerosols have been my primary research focus, I figured that now would be a good time to talk about how aerosols affect the climate picture in general, and how climate change influences these haze events.

The simple definition of an aerosol is that it's anything suspended in the air that is not a water droplet or ice crystal. Aerosols are something of an X-factor in the climate puzzle because their effects on the Earth’s energy balance are difficult to quantify. There are two types of aerosol effects. The direct effect involves the absorption and scattering of incoming solar radiation by the aerosol itself. The indirect effect involves the way the presence of aerosols influences cloud formation and the size of the cloud droplets. The ability of aerosols to absorb and scatter radiation depends on the amount of the aerosol present, the size and shape of the aerosols, and the chemical make-up of the aerosols. For example, sulfate aerosols absorb very little sunlight and produce a strong cooling effect, while black carbon aerosols like the haze in forest fires absorb enough sunlight to produce at least as much of a warming affect as a cooling effect.

Figure 1: Aerosol optical depth data from an AERONET site at Brookhaven National Laboratory for May 2023.


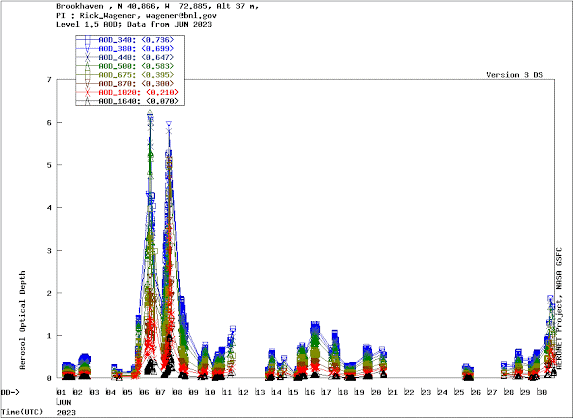
Figure 2: Aerosol optical depth data from an AERONET site at Brookhaven National Laboratory for June 2023.

Scientists monitor the amount and movement of aerosols from satellites in space, and also from a network of stationary devices on the ground. The most established ground-based aerosol monitoring network is called the Aerosol Robotic network, or AERONET.  The primary quantity that AERONET measures is called the aerosol optical depth, which is a measure of what fraction of sunlight at a given wavelength is prevented from reaching the ground by the aerosols. There are two AERONET sites near me; one is called LISCO and is located on a small island in the Long Island Sound, and the other is located at the Brookhaven National Laboratory.  Figure 1 shows the optical depth measured at the Brookhaven site across the month of May, which was a pretty normal month from an aerosol perspective, and Figure 2 shows the optical depth for the month of June. Typically the aerosol optical depth in this part of Long Island doesn't exceed more than 0.3, though occasionally you get a pollution episode where the optical depth can exceed 1.0. The major issue in these events is not the quantity of pollution, but rather the existence of a temperature inversion in the air that prevents pollution from dispersing and instead causes it to accumulate. That’s not what happened in June. As you can see, on June 6 and 7, the optical depth at the smallest wavelengths exceeded 6.0.  (For small particles, the optical depth at low or violet wavelengths is much larger than that at high or red wavelengths.)  To put this in perspective, the major Saharan dust storms that produce aerosol clouds which can be easily tracked as they cross the Atlantic Ocean typically have an optical depth of around 2.0.

Why are these fires happening?  A number of factors influence wildfires, from natural factors like the dryness of the wood to more artificial factors like human carelessness at campfires.  When I’ve looked at articles and posts online concerning the haze and read the comments, forest management has often been presented as the reason that forest fires are raging out of control.  (See here, here, and here for examples.)   Sometimes forest management is used as a counter-argument to the idea that a warming climate influenced the fires, as though the two ideas are mutually exclusive.  There is indeed an element of truth to the notion that forest management can be improved on, but not necessarily in the ways that the people writing and reading these articles may think. Historically, most forest management in the United States and elsewhere has emphasized suppressing all fires, regardless of whether people are being affected by them. The problem with that is that when you don't allow fires to burn in areas that don't directly affect people, the fuel remains for the next fire. You can argue that all it takes to keep fires in line is to clear out the undergrowth and cut enough trees to maintain sufficient space.  But even if the labor required to do this over vast stretches of wilderness were not a prohibitive logistical obstacle, the fact remains that the undergrowth is an essential part of the forest ecology — as is the occasional fire.  The best strategy to prevent the really big fires is to apply controlled burns in areas that have gone an unnaturally long time between fires. In a controlled burn, fires are set intentionally when the wind is low and the fuel is relatively moist so that the burn can be confined to a specific area.  This reduces the amount of fuel to a manageable level in a way that enables the sprouting of certain seeds in the forest and enhances the health of the ecosystem as a whole.

In order to analyze the role that global warming plays in these fires and the associated haze events, you need to connect the dots. Warmer temperatures mean more evaporation, and ultimately more precipitation as well. Most additional evaporation will happen where the most evaporation is already happening, and most additional precipitation will take place where most of the current precipitation is already happening. In other words, wet areas will get wetter and dry areas will get dryer. This logic also applies to areas that experience wet seasons and dry seasons, or periodic wet spells and dry spells.  Eastern Canada has had an unusually large dry spell this spring and summer, parching the wood and the undergrowth in the forests. And as I talked about in a previous post about wildfires in Australia in 2020, how a fire spreads does not depend on how it was started. It depends on the quantity and dryness of the fuel.

So the warming climate doesn't create fires where they wouldn't already happen, but it can and does make these fires worse.  And you can live pretty far away from the fires and still see the end result.