Saturday, July 29, 2023

El Niño events: what are they, and what does it mean when we're in one?


Every few years or so, you’ll hear or read in the news that the Earth is entering what is called an El Niño event.  What exactly does that mean, and how are El Niño events like the one in its early stages now linked to global climate?

In the eastern tropical Pacific Ocean, warm surface water is normally blown westward by the trade winds, allowing colder water to rise up to the surface.  Periodically this motion and the corresponding upwelling get stronger.  But equally periodically the motion and upwelling get suppressed, and the eastern Pacific gets unusually warm.  The Spanish settlers in Peru observed unusual warm spells around Christmas time due to these events, and called them “El Niño” in honor of the baby Jesus.  The other end of the cycle would eventually get called “La Niña.”  The scientific community eventually spotted a correlation between El Niño and La Niña events and a previously observed cycle of air pressure variation in the South Pacific called the Southern Oscillation.  As a result, scientists typically refer to the phenomenon as the “El Niño Southern Oscillation,” or ENSO for short.  The National Oceanic and Atmospheric Administration, or NOAA, quantifies this phenomenon using a number of different factors in the form of a number called the multivariate ENSO index (MEI).  This number is positive during El Niño events and negative during La Niña events.  Figure 1 shows the plot of the index vs. time since 1980.  There were particularly strong El Niño events in 1998 and 2016.  A prolonged La Niña event lasting over three years ended in early 2023, but now the cycle has finally reversed and an El Niño event is gathering momentum.


Figure 1: NOAA's multivariate ENSO index plotted vs. time.

El Niño events are well known for their ripple effects that spread across the globe.  Southern California typically gets quite a bit more rain during an El Niño event than it normally gets, for example.  Hurricane activity, in terms of both frequency and magnitude, typically intensifies in the Pacific and dampens in the Atlantic during an El Niño event.  The last strong El Niño in 2016 produced a hurricane in the Pacific whose maximum sustained winds exceeded 200 mph, a first among recorded storms.  And during a La Niña event, these hurricane patterns are reversed.  But the ENSO cycle produces a “big picture” effect as well.  The cold water that normally upwells to the surface in the eastern tropical Pacific cools the air above it, but the suppression of this upwelling during El Niño means that the sea surface is warmer than normal.  This warms the air above it, causing a significant increase in tropical air temperatures which then spreads globally.  As a result, global mean temperatures tend to be warmer than normal during El Niño events and colder during La Niña events. 

This can be observed in global temperature records.  Figure 2 shows the seasonally averaged global mean temperatures from the NASA/GISS dataset.  Most years that break a temperature record are years with El Niño events, and most years with relatively low temperatures (excepting major volcanic eruptions) are years with La Niña events.  The ENSO cycle is in fact the dominant source of short-term natural variability in the temperature record, greatly surpassing the variability due other factors like incoming solar radiation.  Failure to account for this phenomenon, whether through an honest misunderstanding or willful misrepresentation, has led to poor interpretations of the temperature record in the recent past.  After the exceptionally strong El Niño in 1998, for example, La Niña events dominated the cycle for more than fifteen years and it took until 2014 for global mean temperatures to unequivocally exceed the 1998 peak.  This led many people to proclaim some variant of “global warming stopped in 1998,” or “global warming went on hiatus,” but the updated temperature record clearly shows that didn’t happen.  Besides, the extra upwelling of cooler water in the eastern tropical Pacific during La Niña events leads to extra downwelling of warm ocean water in other locations.  This warm water carries some of the Earth’s additional heat down with it.  And last time I checked, the oceans were part of the globe.


Figure 2: The seasonal means in the NASA/GISS temperature record, both globally (top) and in the tropics (bottom).

Since the really strong El Niño of 2016 and the corresponding sharp peak in global mean temperatures, the La Niña events have again dominated.  This has temporarily kept global mean temperatures from shooting past our previous record high, but now the cycle has reversed.  We are seeing significant heat waves over much of the world, a number of days in July have set and reset the bar for the warmest day ever recorded, and July is likely to end up hotter than any other month on the record.  There is a real possibility that 2023 will be the warmest year on record, despite a fairly cool start.  And the El Niño event is just getting started.  A strong enough El Niño could even push global mean temperatures temporarily more than 1.5ºC above pre-Industrial levels, a threshold which adherents to the 2015 Paris Agreement promised to try to avoid.  

To summarize, the global temperature effects of the ENSO cycle oscillate around the increasing trend due to greenhouse gases.  What we’re seeing now isn’t the new normal — yet — but the 2016 El Niño made the 1998 temperature peak look cool in comparison, and we need to face the very real possibility that the next big El Niño after this one will make this summer seem cool.

(For updates on new posts, please click the "Follow" button.)

Wednesday, July 12, 2023

One Hazy, Crazy June


The Sun, still high up in the sky over Long Island on June 7, 2023, taken on my phone without any sort of filters or adjustments.

Over the past month, the northeastern United States has experienced a series of very large haze events due to forest fires in eastern Canada.  Since haze is an example of an aerosol, and aerosols have been my primary research focus, I figured that now would be a good time to talk about how aerosols affect the climate picture in general, and how climate change influences these haze events.

The simple definition of an aerosol is that it's anything suspended in the air that is not a water droplet or ice crystal. Aerosols are something of an X-factor in the climate puzzle because their effects on the Earth’s energy balance are difficult to quantify. There are two types of aerosol effects. The direct effect involves the absorption and scattering of incoming solar radiation by the aerosol itself. The indirect effect involves the way the presence of aerosols influences cloud formation and the size of the cloud droplets. The ability of aerosols to absorb and scatter radiation depends on the amount of the aerosol present, the size and shape of the aerosols, and the chemical make-up of the aerosols. For example, sulfate aerosols absorb very little sunlight and produce a strong cooling effect, while black carbon aerosols like the haze in forest fires absorb enough sunlight to produce at least as much of a warming affect as a cooling effect.

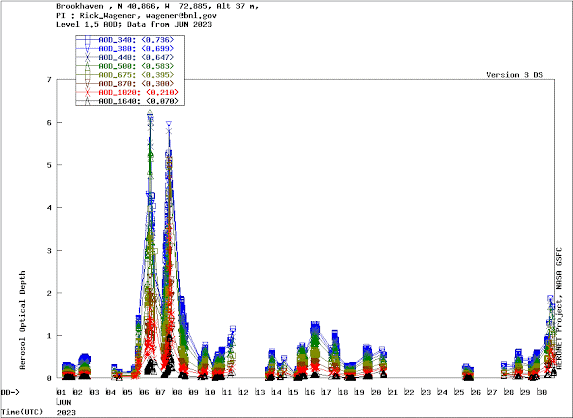
Figure 1: Aerosol optical depth data from an AERONET site at Brookhaven National Laboratory for May 2023.


Figure 2: Aerosol optical depth data from an AERONET site at Brookhaven National Laboratory for June 2023.

Scientists monitor the amount and movement of aerosols from satellites in space, and also from a network of stationary devices on the ground. The most established ground-based aerosol monitoring network is called the Aerosol Robotic network, or AERONET.  The primary quantity that AERONET measures is called the aerosol optical depth, which is a measure of what fraction of sunlight at a given wavelength is prevented from reaching the ground by the aerosols. There are two AERONET sites near me; one is called LISCO and is located on a small island in the Long Island Sound, and the other is located at the Brookhaven National Laboratory.  Figure 1 shows the optical depth measured at the Brookhaven site across the month of May, which was a pretty normal month from an aerosol perspective, and Figure 2 shows the optical depth for the month of June. Typically the aerosol optical depth in this part of Long Island doesn't exceed more than 0.3, though occasionally you get a pollution episode where the optical depth can exceed 1.0. The major issue in these events is not the quantity of pollution, but rather the existence of a temperature inversion in the air that prevents pollution from dispersing and instead causes it to accumulate. That’s not what happened in June. As you can see, on June 6 and 7, the optical depth at the smallest wavelengths exceeded 6.0.  (For small particles, the optical depth at low or violet wavelengths is much larger than that at high or red wavelengths.)  To put this in perspective, the major Saharan dust storms that produce aerosol clouds which can be easily tracked as they cross the Atlantic Ocean typically have an optical depth of around 2.0.

Why are these fires happening?  A number of factors influence wildfires, from natural factors like the dryness of the wood to more artificial factors like human carelessness at campfires.  When I’ve looked at articles and posts online concerning the haze and read the comments, forest management has often been presented as the reason that forest fires are raging out of control.  (See here, here, and here for examples.)   Sometimes forest management is used as a counter-argument to the idea that a warming climate influenced the fires, as though the two ideas are mutually exclusive.  There is indeed an element of truth to the notion that forest management can be improved on, but not necessarily in the ways that the people writing and reading these articles may think. Historically, most forest management in the United States and elsewhere has emphasized suppressing all fires, regardless of whether people are being affected by them. The problem with that is that when you don't allow fires to burn in areas that don't directly affect people, the fuel remains for the next fire. You can argue that all it takes to keep fires in line is to clear out the undergrowth and cut enough trees to maintain sufficient space.  But even if the labor required to do this over vast stretches of wilderness were not a prohibitive logistical obstacle, the fact remains that the undergrowth is an essential part of the forest ecology — as is the occasional fire.  The best strategy to prevent the really big fires is to apply controlled burns in areas that have gone an unnaturally long time between fires. In a controlled burn, fires are set intentionally when the wind is low and the fuel is relatively moist so that the burn can be confined to a specific area.  This reduces the amount of fuel to a manageable level in a way that enables the sprouting of certain seeds in the forest and enhances the health of the ecosystem as a whole.

In order to analyze the role that global warming plays in these fires and the associated haze events, you need to connect the dots. Warmer temperatures mean more evaporation, and ultimately more precipitation as well. Most additional evaporation will happen where the most evaporation is already happening, and most additional precipitation will take place where most of the current precipitation is already happening. In other words, wet areas will get wetter and dry areas will get dryer. This logic also applies to areas that experience wet seasons and dry seasons, or periodic wet spells and dry spells.  Eastern Canada has had an unusually large dry spell this spring and summer, parching the wood and the undergrowth in the forests. And as I talked about in a previous post about wildfires in Australia in 2020, how a fire spreads does not depend on how it was started. It depends on the quantity and dryness of the fuel.

So the warming climate doesn't create fires where they wouldn't already happen, but it can and does make these fires worse.  And you can live pretty far away from the fires and still see the end result.


Thursday, June 1, 2023

The Human Climate Niche

Every so often, I spot an unfamiliar word or phrase in the jargon of climate science.  One such term that caught my attention this past week is “climate niche.”  To the best of my present awareness, the term first appeared in a 2019 paper written by an international team headed by Chi Xu and published in Proceedings of the National Academy of Sciences.  The abstract of this paper begins with the rather ominous phrase “All species have an environmental niche, and despite technological advances, humans are unlikely to be an exception.”  The scientists involved in this study dug through historical climate data and drew the conclusion that most human activity, especially most of the agriculture associated with human activity, has taken place in areas where the mean annual temperature varies between 11ºC and 15ºC (52ºF and 59ºF).  There is a second, smaller niche between 20ºC to 25ºC (68ºF to 77ºF), where people in hot climates have gathered around areas with abundant water.  This pattern has remained consistent for 6000 years; in other words, humanity has had definite preferences where climate is concerned.  But of course, there is a catch.  Some regions that have fallen safely within these niches for millennia might not do so for much longer if the planet continues to warm.

The subject of climate niches garnered further attention this past week when a team comprised mostly of authors of the 2019 paper published a follow-up in Nature Sustainability.  This paper focuses on the human cost of population centers falling beyond the range of our climate niches.  The authors focus on people who, if they stay where they are, will find themselves living in an area with a mean average temperature of 29ºC (84ºF) — above the edge of the warm niche described in 2019, and warmer than any significant population center has ever consistently experienced.  Basically, given no change in current emissions policies worldwide, a median projected temperature increase of 2.7ºC (4.9ºF) by the end of this century will put one third of the world’s population above the 29ºC threshold.  This number would be substantially reduced if emissions are reduced, but the number most likely will not go down to zero.  

So what happens?  Some people, mostly in the tropics, will just have to get used to more frequent and dangerous heat.  Or perhaps they’ll have to deal with less water, or less ability to grow crops or make a living.  Perhaps they’ll have to deal with all of the above, plus rising sea levels if they live on a coast or more powerful storms when they do get rain.  Or, perhaps, they’ll need to move.  But to where?  And how warmly will they be welcomed?  This is why the cost of adapting to the world’s changes should not be taken lightly.  The old adage “an ounce of prevention is worth a pound of cure” applies here.

Tuesday, May 23, 2023

Because My Daughter Asked Me To

OK, so I haven’t been anywhere near as diligent with these blog posts as I had originally intended. Life, work, play, husbanding, and parenting take up a lot of time. Who knew? Oh yeah, and there was that whole pandemic thing. But my biggest fan — i.e., my daughter — asked me to start it back up. And who am I to refuse a request like that?

To be fair, she is perfectly entitled to an honest explanation of what is going on in the world. Parents have long made a point of complaining about having to clean up their children’s messes, but where it matters most, the roles are reversed. The changing climate is our mess. We properly tell our kids their actions have consequences, but they’re going to spend their adulthood dealing with the consequences of their parents’ and grandparents’ actions. This issue is not going to go away — not in our lifetimes to be sure, and most likely not in theirs either. But we can still do plenty to ease our children’s burden.

The first thing we can do is inform ourselves, so that we can make better decisions and also give our children the knowledge they need to go further than we will have time to do. And that starts with dialog. Scientists like me who have a background in climate try to share what we know with the public, but we still need to do a better job. In particular, we need to be persistent in the face of people who would have you disbelieve the thermometers, and the CO2 monitors, and all the dots that a great many scientists have connected in 200 years of investigation.

Of course, we’ll also need to act on what we know. That may seem like a daunting task. But all of us who are parents have tried to instill in our children a sense of responsibility. More cynically, plenty of us have criticized younger generations for acting like they’re spoiled and entitled, or for not caring enough to do hard work to accomplish what needs to be accomplished. Well, it’s time for us to put our money where our mouths are.

Wednesday, February 9, 2022

Lazard's Levelized Cost of Energy, 2021


A solar farm with battery storage in Gannawarra, Australia (click here for the article).

In my opinion, one of the most useful tools for understanding what it will take to make the necessary transition from carbon-intensive to non-emitting fuels is the annual report of the levelized cost of energy issued by the financial firm Lazard.  I discussed the 2020 version of the report in a previous blog post, and now I’m going to talk about the report that was issued in October 2021.  There weren’t any dramatic changes in cost this past year, which I suppose can be looked at as glass-half-full given all the supply chain issues caused by the pandemic.  New utility scale solar ($28-41/MWh) and wind ($26-50/MWh, with a drop from $83 to $80/MWh for offshore) continue to be very cost competitive compared to new gas ($45-74/MWh) and especially to new coal ($65-152/MWh).

However, the very substantial drop in the cost of wind and solar over the last decade is leveling off (see the figure for “Levelized Cost of Enrgy Comparison — Historical Renewable Energy Declines”). In addition, the caveat of intermittency remains with both solar and wind. That is, they can’t produce a steady stream of energy over all times of the day. So in order to go to a fully renewable energy sector, some amount of storage in the form of batteries will be needed. And the cost of renewables plus battery storage still remains remains fairly high, ranging from $85-158/MWh for a solar farm that can generate 50 MW of power while storing 200 MWh. This is a lot higher than the cost of renewables without storage, but still cheaper in general than new nuclear ($131-204/MWh), the only source of power that is both non-emitting and non-intermittent.  Nuclear can generate energy at a cost of only $29/MWh once the construction of the plant is paid off, though.  This means that it makes good economic and environmental sense to keep the existing plants going if they are operating well and do not require major renovations.  However, the nuclear industry still has to show that new plants can produce clean energy more cheaply than renewables even with storage taken into account if it wishes to remain relevant in the long term.  Right now, the burden of proof is on them.

Some storage is necessary and inevitable, but barring a major breakthrough in battery costs, a modernized grid that readily transports electricity across the country or continent in order to minimize the total amount of needed storage would likely save a lot of money compared to more localized generation and storage.  A system designed to never produce too little energy would sometimes produce more electricity than it can store, however.  This raises the question of what to do with the excess energy.  On a small scale, the island of Orkney to the north of Scotland uses excess renewable energy to electrolyze water into hydrogen, a clean fuel.  That process shows considerable long-term promise, but hydrogen is an alternative fuel with many factors to consider.  It deserves at least one blog post on its own, and hopefully I’ll get to that next.

Wednesday, October 20, 2021

The Keeling Curve in 2021

In the late 1950s, a scientist named Charles Keeling placed instruments designed to monitor the amount of carbon dioxide in the atmosphere at research sites that were chosen for the relative cleanness of their air.  The first was on the summit of Mauna Loa in Hawaii, and the second was in Antarctica.  As the fifties segued into the sixties, two patterns emerged from the resulting data.  The first is the natural annual cycle.  Carbon dioxide levels in the atmosphere peak every May.  As spring advances in the Northern Hemisphere, the global increase in photosynthesis (due to the fact that the Northern Hemisphere holds most of the world’s land) starts to remove carbon dioxide from the air, and global CO2 levels go down.  But in the Northern Hemisphere autumn, when the leaves fall, decay, and release their stored carbon, the CO2 levels start to go back up.  The second pattern Keeling observed was the steadily increasing trend in CO2 amounts on a year-to-year basis.  Keeling’s data were clear enough by 1965 that the increase in CO2 and its implications for global temperatures were mentioned in a broad report of the effects of air pollution presented to President Lyndon Johnson by his Science Advisory Committee.  Frank Ikard, president of The American Petroleum Institute, would bring the issue to the attention of the Institute’s members in its annual meeting the following month.  “The substance of the report is that there is still time to save the world’s peoples from the catastrophic consequence of pollution,” Ikard said, “but time is running out.  One of the most important predictions of the report is that carbon dioxide is being added to the Earth’s atmosphere by the burning of coal, oil, and natural gas at such a rate that by the year 2000 the heat balance will be so modified as possibly to cause marked changes in climate beyond local or even national efforts.”

Figure 1


Ikard drew that conclusion based on a relatively small amount of data, but as Figure 1 shows, concerns about the trend in atmospheric amounts of carbon dioxide (along with their subsequent effect on climate) proved to be very well-founded.  In 1960, the Mauna Loa device recorded 320 parts per million (ppm) of carbon dioxide in the atmosphere for the first time.  (Basically, if a slice of the atmosphere could be broken into one million equally sized cubes, carbon dioxide would fill up 320 of those cubes.)  In 2013, the site recorded 400 ppm for the first time.  And this May, it recorded 420 ppm for the first time.  

Figure 2


So yes, carbon dioxide levels have increased by a lot over sixty years.  But has the rate of increase slowed down, at least?  And has the global drop in emissions that resulted from the pandemic noticeably affected this rate?  To answer this question, we are going to look at the Keeling curve in another way.  Figure 2 shows the change in the measured monthly mean of CO2 measured at Mauna Loa relative to the previous year’s amount for the same month.  The first thing that sticks out is the general increasing trend; this means that the rate of increase has, for the most part, accelerated.  But the curve is not a smooth one, and both natural and artificial events emerge from the data if you know what to look for.  Note the large spikes in 1998 and 2016.  These coincided with major El Niño events, and there is a physical explanation for that correlation.  There was also a prolonged period in the late 1980s and early 1990s where the rate of increase steadily dropped, although it did not disappear.  This coincided with the collapse of the Soviet Union and the Eastern bloc.  As for the past year, the rate of increase is a bit low relative to recent years.  This can be easily explained by the pandemic, but it is worth noting that atmospheric levels of carbon dioxide still increased at a rate that would have been considered high in the decade of the 2000s.  

At this point, you might be wondering why events which produce a noticeable drop in emissions do not decrease the amount of carbon dioxide in the air.  The primary answer is that carbon dioxide, once put in the air, can hang around for a very long time.  To be specific, it has a half-life in the air of about fifty years.  So roughly half of the CO2 emitted in 1971 years ago is still in the air, and half of the emissions caused by the electricity and transportation we use today — unless a cost-effective means of direct removal is developed in the meantime — will still be there in 2071.  This means that it will take a prolonged, substantial reduction in emissions before we can slow down, and ultimately reverse, the increase of CO2 in our atmosphere.  

There is another factor to consider as well.  The permafrost, or tundra, stores carbon dioxide in the ground for very long periods of time.  But when the permafrost starts melting due to rising temperatures, the carbon dioxide gets released back to the air.  This is an example of a positive feedback, where warming creates an effect that leads to more warming.  So the warmer we allow the temperature to reach, the harder it will be for nature to bring carbon dioxide levels back down near pre-Industrial levels should we ever stop emitting CO2.

We are therefore still a long way from getting atmospheric amounts of CO2 under control.  While there is grounds for optimism regarding the cost of transitioning to clean sources of energy, the transition needs to be implemented with much greater urgency.  A major climate conference is happening in Glasgow, Scotland beginning on October 31.  Emissions reductions will be discussed.    Whether the discussion will lead to serious action remains to be seen.

Tuesday, July 13, 2021

Emission-Free Airplanes: Present and Future

 
Harbour Air's electric airplane (from www.harbourair.com)

Where coverage of reducing the amount of carbon dioxide in our atmosphere is concerned, the big headlines often go to big names backing big solutions. Artificially sucking carbon out of the air, and covering the entire the entire sky in a shroud of sun-reflecting aerosols, have garnered quite a lot of press for technologies that don’t really exist yet.  But plenty of people are looking at practical ways to eliminate emissions from the most challenging sources, instead of accepting that their emissions must continue indefinitely.  The emissions source that poses the biggest challenge is the airplane. The quest to develop emissions-free airplanes doesn’t get a whole lot of attention.  Perhaps people assume that it’s going to be too hard, even though large-scale carbon removal or dust-spreading are not any more technologically feasible right now. (On a more cynical note, artificially removing carbon dioxide or filling the stratosphere with particles allows for the possibility of fossil fuels continuing to burn — while if airplanes don’t need fossil fuels, what does?) However, there are some interesting recent articles on emissions-free airplanes that give a good assessment of what can and can’t be done presently, and what the obstacles for future development are.

One article
published by Energy Monitor in May talks about a western Canadian seaplane company called Harbour Air.  They have been making regular test flights of a prototype commercial electric airplane since 2019, and they have recently announced a partnership with a battery supplier.  Their long-term goal is to fully electrify their fleet.  What makes this article particularly interesting is the way Harbour Air CEO Greg MacDougall (who doubles as the test pilot) discusses the logistical hurdles.  These hurdles include mundane things like obtaining certification from the Canadian government, but they also include weight- and space-efficient heat shielding for the batteries (with airplanes, every pound and cubic foot counts a lot), to the advantages of retrofitting old aircraft over building new ones.

In other news, NASA is openly soliciting demonstrations of electric flight.  Cross-country jet flights won’t happen tomorrow — the needed battery power is not only too heavy at present, it would take up the whole plane — but smaller electric aircraft traveling relatively short distances are already viable.  NASA’s objective is to stretch the carrying capacity of these flights from a few people to up to a hundred by the end of the decade.  Green air technology is still very young, and NASA wants to see who has the best ideas.

I also decided to take a look into what people have done with solar-powered flight, and I found a couple of good articles on the subject.  The first was published just this January.  It begins by acknowledging the accomplishments of two Swiss aviators who crossed the globe in a solar powered aircraft.  But from the perspective of commercial flight, there is a major drawback: the plane’s maximum speed was 75 km/hr, or 47 mph — slower than a car at highway speed, and much slower than a jet.  The plane also needed batteries accounting for 25% oof the plane’s weight to keep running at night.  Factor in trying to fly when the sky is not crystal clear, and there are some major hurdles that need to be overcome.  The second article is a response to a question posed to the faculty at the MIT School of Engineering.  There are a couple of engineering issues if you wish to maximize the energy that solar panels generate.  The first of these is that the angle that the sunlight makes with the panels is a lot more variable than it would be for a stationary object.  The second is that the energy need to maintain cruising speed varies with the cube of the speed (i.e., if you double the speed it will take eight times as much energy to maintain it).  Third, and perhaps most obviously, is that flights powered entirely by solar energy would be limited by the weather.  So while solar planes can be and are used for applications like data collection that can be done at low speeds and high altitudes, commercial flights relying solely on the Sun for power are not likely.  But solar power can still conceivably be used in tandem with other energy sources.

For some small-scale applications, like island-hopping along the Pacific Coast in Canada, emissions-free airplanes are already viable enough to start carrying passengers.  But commercial jet travel without emissions remains a daunting obstacle.  My guess is that short-range flights for business trips will eventually be phased out in favor of high-speed rail; the technology exists, and the trains are as clean as the energy that powers them.  Mid-range flights, on the order of 500 to 1000 miles, will require a significant improvement in the energy density of the batteries.  People are working on that, and NASA’s interest speaks for itself, but the technology does not exist now.  As for longer flights, solar might have a supportive role to play.  The planes would have to get to a high altitude, much like what has been proposed for a new generation of supersonic jets.  Going above the ozone layer would not only reduce the air drag that a plane would need to overcome in order to maintain speed, but it would also give solar panels access to the UV radiation that gets absorbed in the ozone layer.  That could reduce the burden on the batteries significantly, but as I said before, the energy density of the batteries will still need to increase substantially for this to become feasible.  (And, obviously, such flights couldn’t happen at night).

One thing that people need to keep in mind with airplanes, though, is that they account for only 2% of total global emissions of carbon dioxide.  If we seriously act to make electricity generation emissions-free over the next 15 years and electrify our other sources of transportation as well, we will have nearly solved the climate crisis.  And hopefully, by the end of that time, low- or no-emissions flights will be much closer to becoming a reality.